Comprehensive Wi-Fi Network Discovery
Introduction

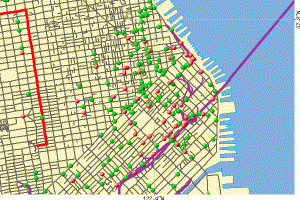
Since Pete Shipley first pioneered wardriving in the San Franciso-Bay area, many people have cataloged the locations of 802.11 networks around the world.
I still remember the excitement, in the early days, driving the streets of downtown with a makeshift antenna, Orinoco ‘Gold’ card, and the soft glow of a Thinkpad 600x illuminating the passenger seat. You could often drive several miles before the faint signal of a distant access point would flicker across the screen.
Much has changed since then, as the number and density of networks have exploded.

Also, small hand-held devices like the Nokia n810 and Apple iPhone are able to scan for networks, track location via GPS and log results, in a small and compact form-factor.
Still, though, it seems that few, if any, network surveys published offer truly comprehensive details on all detectable networks within a given area.
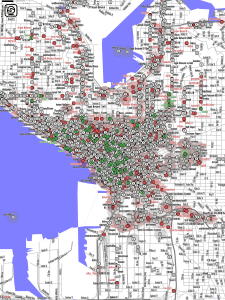
A couple of exceptions are a survey of metro Seattle performed by 100 undergraduate students who detected 5,225 networks in 2004 and the annual RSA/EMC wireless security survey of New York, London and Paris which attempts to log, and provide some analysis of, detectable wireless networks within those three cities.
Most other surveys continue to focus their efforts on main arteries and thoroughfares where large numbers of networks can be detected in short amounts of time.
Approach
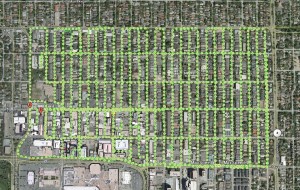
In the following survey, an attempt is made to detect all available 802.11 wireless networks within the target neighborhood by traversing all publicly accessible streets, alleys and side-roads.
A constant and slow travel velocity is maintained to ensure that, given the antenna’s sensitivity and the detector’s scan rate, no available networks go undetected.
Multiple passes are made through the neighborhood to verify consistent detection.
Target

For my experiment, I chose the Cherry Creek North neighborhood of Denver, CO.
According to the 2000 US census, the area has a population of 5,028 in 3,198 households. In addition, 320 businesses, mostly restaurants and boutiques, are located on the southern edge of the neighborhood.
The area covers approximately 0.5 square miles, and is bounded by 1st and 6th Avenues to the south and north, and by University and Colorado Blvds to the east and west.
Discovery
On July 18th, a test scan was performed. A small segment of the target area was scanned repeatedly on foot, and by car, at various velocities. Results checked for accuracy and completeness.
On July 19th, I carried out a thorough scan of the neighborhood. A Macbook Air and Columbus V-900 tracking device were used to view precise location and path, validating that all streets and alleys were traversed. Meanwhile, an iPhone 3G and Wififofum were used to detect and log detected networks, their location, and attributes.
Results
The 70 city blocks which make up the neighborhood were covered in just over two hours.
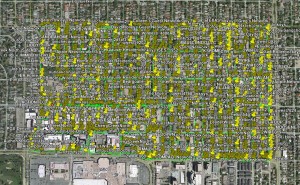
1,948 wireless 802.11 networks were discovered.
11.6% of the networks observed were hiding their ESSID, and 88.4% were broadcasting.
Most of the networks (57%) had weak or non-existent security activated.

Security
Strong (43%)
- WPA2: 422 (21.7%)
- WPA: 406 (20.8%)
Weak (57%)
- WEP: 797 (40.9%)
- None: 324 (16.6%)
The location of the highest network density along the scanning path was detected at the intersection of 3rd Ave and Fillmore St, where 65 networks were detected simultaneously.
Summary
1,948 networks were detected in 2 hours, 29s within a 70 block area (0.48 square miles).
On average, a new network was detected every 3.7s during the scan.
Number of wireless networks per…
- square mile: 4,091
- city block: 28
- acre: 6
Let’s compare with the 2008 RSA/EMC study of New York City.
Their scan detected 9,227 networks and covered a 16 square mile area (conservative estimate) which included “the entire area of Manhattan, including Brooklyn, Manhattan and Williamsburg Bridges”.
That’s 576 access points per square mile, or less than 1/5th the density observed in the Cherry Creek North neighborhood.
It is doubtful that Cherry Creek North has a significantly more dense distribution of WiFi networks than Manhattan. More likely, the survey presented here is more comprehensive in its coverage.
The results show that, by using a rigorous scanning process, which utilizes multiple passes and takes into account the sensitivity and operational characteristics of the detector, network survey accuracy can be drastically increased.
In this survey, 1 wireless network was detected per every 2.5 residents in the neighborhood.
I have not been able to find any other documented survey which shows a higher density of access points per person or square mile.
If you’d like to view the results in Google Earth… click:
Cherry Creek North WiFi Scan KML